09 May Why You are Probably Analyzing the Performance of Your Social Content Incorrectly
Established marketing platforms like TV, print, email, and digital have a standard way of measuring success. In many cases, these platforms have dedicated companies to measure performance like Nielsen for TV and BPA Worldwide for print. Social; however, is an entirely different story, and you’re probably measuring content performance incorrectly. In this post, we’ll look at some of the crucial issues with content analysis on social and talk about best practices for making sure your content is doing what it was created to do.
There are four factors that make it difficult to develop social media benchmarks for content performance.
1. Not All Data Is Public

When benchmarking your brand’s performance against competitors or an industry, it should be easy enough to pull likes, comments, and shares over fans/followers. In fact, this methodology is the industry standard way for comparing against competitors. Benchmarking services exist that make good use of this data, such as Unmetric; however, their data collection is limited to what is made available by the platforms. This means that whether you try to benchmark yourself or use a service, there will be key metrics you’re missing out on like true impressions and click data. Not all posts are intended to drive likes, comments, or shares! Second, when calculating a rate, the only usable public data to serve as the denominator in the equation is fan/follower count. Though this approach to benchmarking is not very accurate, it’s the best methodology the industry currently has.
2. Social Channels Measure Impressions Differently
The ideal numerators for an engagement or click-through rate are impressions or reach. This leads us into the next point of consideration: how each network defines their metrics. An impression on Twitter is not determined by the same methodology as on Facebook. Video views also vary, with Facebook counting a view after 3 seconds compared to YouTube which counts it a certain completion percentage is reached. These inconsistencies rule out any ability to solidify firm benchmarks across social channels. This effectively rules out any benchmarking across channels, but what about just benchmarking for content performance on individual channels? That question leads us to our next challenge.

One of these is not like the other.
3. Constantly Changing Algorithms
Reach relies on so many different factors there is no consistent assumption of how much reach a post might get. Additionally, by the time you have collected enough posts to have a worthwhile sample of data, the algorithm drastically changes rendering your previous data invalid. If you’re hungry for some benchmarks, we wrote a post analyzing 30 pages. Unfortunately, and case-in-point, it’s obsolete following recent changes to slight increases in post reach but feel free to use them as a ballpark measurement.

4. Not All Social Channels Provide Paid Benchmarks For Comparison
Engagement rates and click-through rates aren’t the only way to analyze your content’s performance. With promoted posts, it is important to look at the efficiency of spend in driving to an objective. If your aim is driving impressions, pay close attention to your CPM. Driving engagements? CPE. Driving traffic? CPC. Unfortunately, the networks do not always provide these paid benchmarks for industry or even platform-wide comparison. Twitter and Pinterest have provided benchmarks that we utilize for our planning; however, Facebook and Instagram are not as transparent. Our best source of benchmarking data has proven to be eMarketer, which releases industry and channel benchmark reports every so often.
Here is the Best Practice for Measuring Content Success
Based on the notes above, take any industry benchmarks with a grain of salt. Use them as a pulse check, but not gospel. “But Ryan, how the heck am I supposed to know how my content is performing?” One of the best things you can do is analyze your post by its objective. If a post is intended to send users to your website, measure the click-through rate. Looking at engagement rate for a post not intended to drive engagement can lead to a misinterpretation of the data sending you down a path of inefficient creative! Oh no! If you have a high volume of content, it could also be worth segmenting benchmarks further by looking at content series/campaigns or featured products.
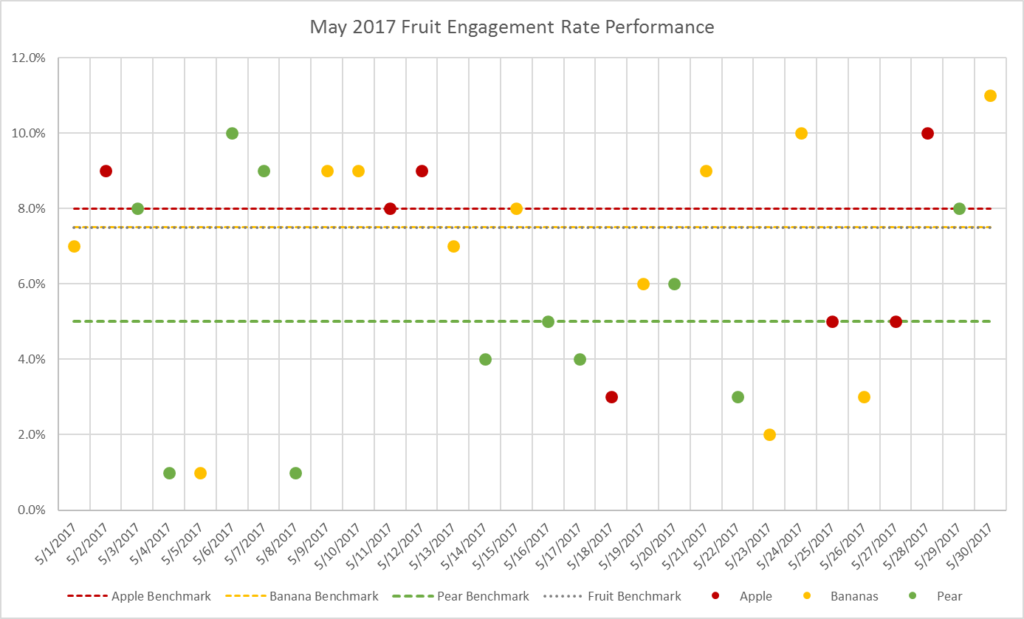
For example, if your company sells fruit, categorize your posts based on the type (i.e. “banana”, “apple”, “pear”, etc.). Then, benchmark the engagement rate performance of your engagement objective fruit posts. In the example below, we can see that pear posts tend to receive lower engagement rates, though there were some significant outliers in early May.

What was it about those posts that stood out to the audience? Are there factors that can be tested and optimized? Why do pear posts generally underperform? How do other content types, such as video and link, perform when featuring pears. Is there an overall issue with the pear product? It could be worth looking at your social listening data to see what opinions are rising to the top regarding pears. Banana posts performed close to or above benchmark, with exception of 3 major outliers. What didn’t work for these posts?
When you think of calculating an “average” are you calculating the mean, median, or mode? They are all valid “averages”, but they can represent data in very different ways. A benefit to using median when calculating social benchmarks is it better accounts for the volume of outliers we tend to see with social data. By using a median to compare your performance, a 20% engagement rate isn’t going to overinflate your benchmarks like an arithmetic mean might. The arithmetic mean is best when the data has a more normal distribution and lacks significant outliers. You probably won’t touch mode in this type of content analysis since mode represents the most frequent occurrence in a data set and is best for categorical analysis. If you categorize your brand/product mentions or customer care messages by issue or topic, mode might be a good way to see which issue or topic is the most-discussed.
By benchmarking against yourself, you can find what is working for your specific audience and what is not.
In Summary
Social media benchmarking is still in its infancy. There have been some attempts to develop industry and platform benchmarks, but they are flawed given the accessibility of data, constantly changing algorithms, and differences from channel to channel. For now, working with what is available is the best way to go for industry/platform benchmarks, keeping in mind the limitations and caveats. When optimizing content performance, the most illuminating benchmarks to look at are those using your existing performance data. The key to benchmarking moving forward is going to be an evolution of a cross-platform standard of measurement as well as a third-party service that can serve the same role for social as Nielsen does for TV and BPA does for print.


